What is MAPE & WMAPE?
MAPE - Bias refers to persistent forecast error - Bias is a component of total calculated forecast error - Bias refers to consistent under-forecasting or over-forecasting - MAPE can be misinterpreted and miscalculated, so use caution in the interpretation.
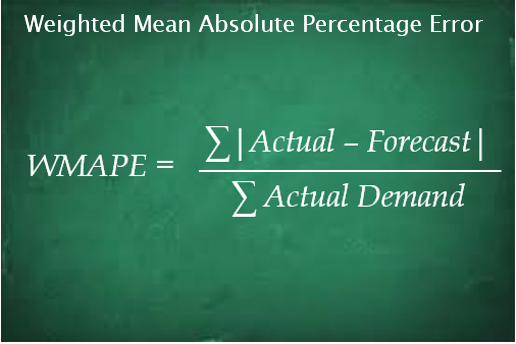
WMAPE stands for "Weighted Mean Absolute Percentage Error." It is a statistical metric used to evaluate the accuracy of a forecasting model by measuring the percentage difference between actual and predicted values, taking into account the magnitude of the values.
The denominator for WMAPE is argued by many: Should it be actuals or forecast?
For starters, if the forecast error is small the denominator does not matter in the final metric
When you observe more uncertainty, the denominator plays a factor and your WMAPE can be significantly differ owing to the denominator.
Simple argument made by most practitioners:
- Since the forecast variable is under the control of the forecaster usually there will be a propensity to forecast high.
- The Actual demand as the denominator helps control for the forecast bias.
More so, if your forecasting reports into Sales or into commercial operations, then there is a higher tendency to bias.
High forecast bias pushes up production and inventories leading to higher service levels. But the calculated WMAPE is much lower because of the high denominator. The only way to mitigate this is to to hold commercial operations or sales responsible for inventories.
I have seen in practical client situations when the Sales team is held accountable for inventory, they are conservative in their forecasting regardless of what the resulting WMAPE is.
How about running out-of-stock due to under-forecasting?
A high demand uncertainty may result in higher observed forecast error, then your inventory management policies should take this into account. Remember the simple safety stock formula includes a factor for the forecast error:
Safety Stock Formula:
Safety Stock = Service Level Factor x √Lead Time x Forecast Error
So if my forecast is unilaterally increased by Sales to cover for safety stock, then essentially its a double whammy! Which means higher forecast and higher production and higher unsold inventories, but also a safety stock portion that includes the extent of the error.
In case of persistent forecast bias, then it needs to be controlled for it in inventory management policies. This can be done by ascertaining a tracking signal and see if it is triggered. If so, then you have to methodically adjust for bias in your total error component that goes into safety stock.
The Tracking Signal is computed using the following formula –
![]()
This is a comedy of errors actually – increasing the forecast to cover for safety stock. Then it leads to the supply chain adjusting the production plan for bias and netting out bias in safety stock calculations.
In essence, this could begin the vicious cycle of demand and supply gaming each other.
To bias a forecast, is it an internal management decision? Will you design a metric to encourage the forecaster to bias high deliberately?
What say you? Actual Demand or Forecast? Share your thoughts on our LinkedIn group as comments to this post
Leave a Reply