What is Tracking Signal -
Tracking signal is used to measure persistent bias - either under-forecasting or over-forecasting.
This is a useful supply chain metric in the planner's tool kit
This came out of the statistical process control literature to measure processes that are out of control.
Most mentions of Tracking signal relate to forecast bias although it can be used to measure other supply chain areas such as customer service, inventory shorts, and even transportation performance. You just need to design it right.
Are you using Tracking signal in your supply chain KPIs?
How do you react to TS that violates the threshold?
Following are the insightful comments from our LinkedIn group:
Mickael Hegesippe:
"Basic statistics and planning indicator of accuracy of the forecast but still difficult to explain in the workplace outside the sphere of demand planning specialists without sounding too nerdy It's quite scary but a lot of people these days can't grasp basic 10 years old maths let alone this which must be in the 13-14 yo curriculum maybe I suppose if we work in demand planning we're always exposed to it (at least those of us who try to understand the basics of what that cool planning software you bought actually does!) so we just get to remember what so many just forgot as soon they left school... Demand planning is a fine art juggling soft and hard skills without looking too distant/awkward. The more you do it the better you get at it..."
Matt Hoffman
"Monitoring and eliminating bias in a planning process is huge! One element I've struggled with in the past is explaining what a poor tracking signal is beyond core planners. You wrote a great article about the relationship to MAD (http://www.forecastingblog.com/?p=39) years ago that I loved with 3 sigmas for TS threshold of -3.75 and 3.75. I've also used 2 sigmas for a Tracking Signal value of 2.5 or -2.5. In order to simplify this, we've normalized the Tracking Signal by diving the result by 1.25 and refer to it as the Tracking Signal Ratio. The resulting metric yields 0, 1, 2, or 3 sigmas of bias... and is simpler to understand. I've also started using Cumulative Error ratio (Cumulative Relative Error) / (Cumulative Absolute Error). As this metric is bound between -1 and 1, it is easy to see how far the bias is, while being much easier to explain to users. I've always agreed with you about the importance of communicating the quality of a forecast, and both of the metrics I mentioned have been easier to communicate to my forecast users than the traditional Tracking Signal, while solving the same need. Would love to hear your thoughts! * Edited to include 3 sigmas as a threshold from Mark's original posting! "
David Kloostra:
"We use this here at Mallinckrodt Pharma's Specialty Generic's division. It is a slow, reactive KPI, but one we use to re-calibrate over a period of time and tells us where we need to focus some decision making time. Straight variance in units along with bias tells us more. Cheers for bringing it up!"
Burno Pires:
"I agree it's slow, but it tells us a lot! I believe that a threshold of 4 can be too high/low for some items, especially if they are too important for your portfolio. Maybe reduce it to 2.75 or 3 could help the planner in making better/faster decisions."
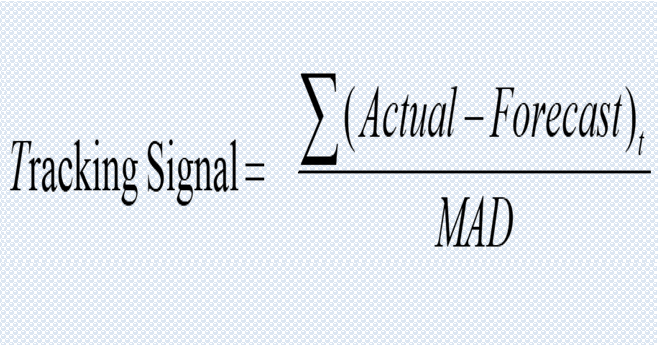
The Tracking Signal is computed using the following formula –
![]()
Read More about Tracking Signal - https://valuechainplanning.com/blog-details/7
Leave a Reply