

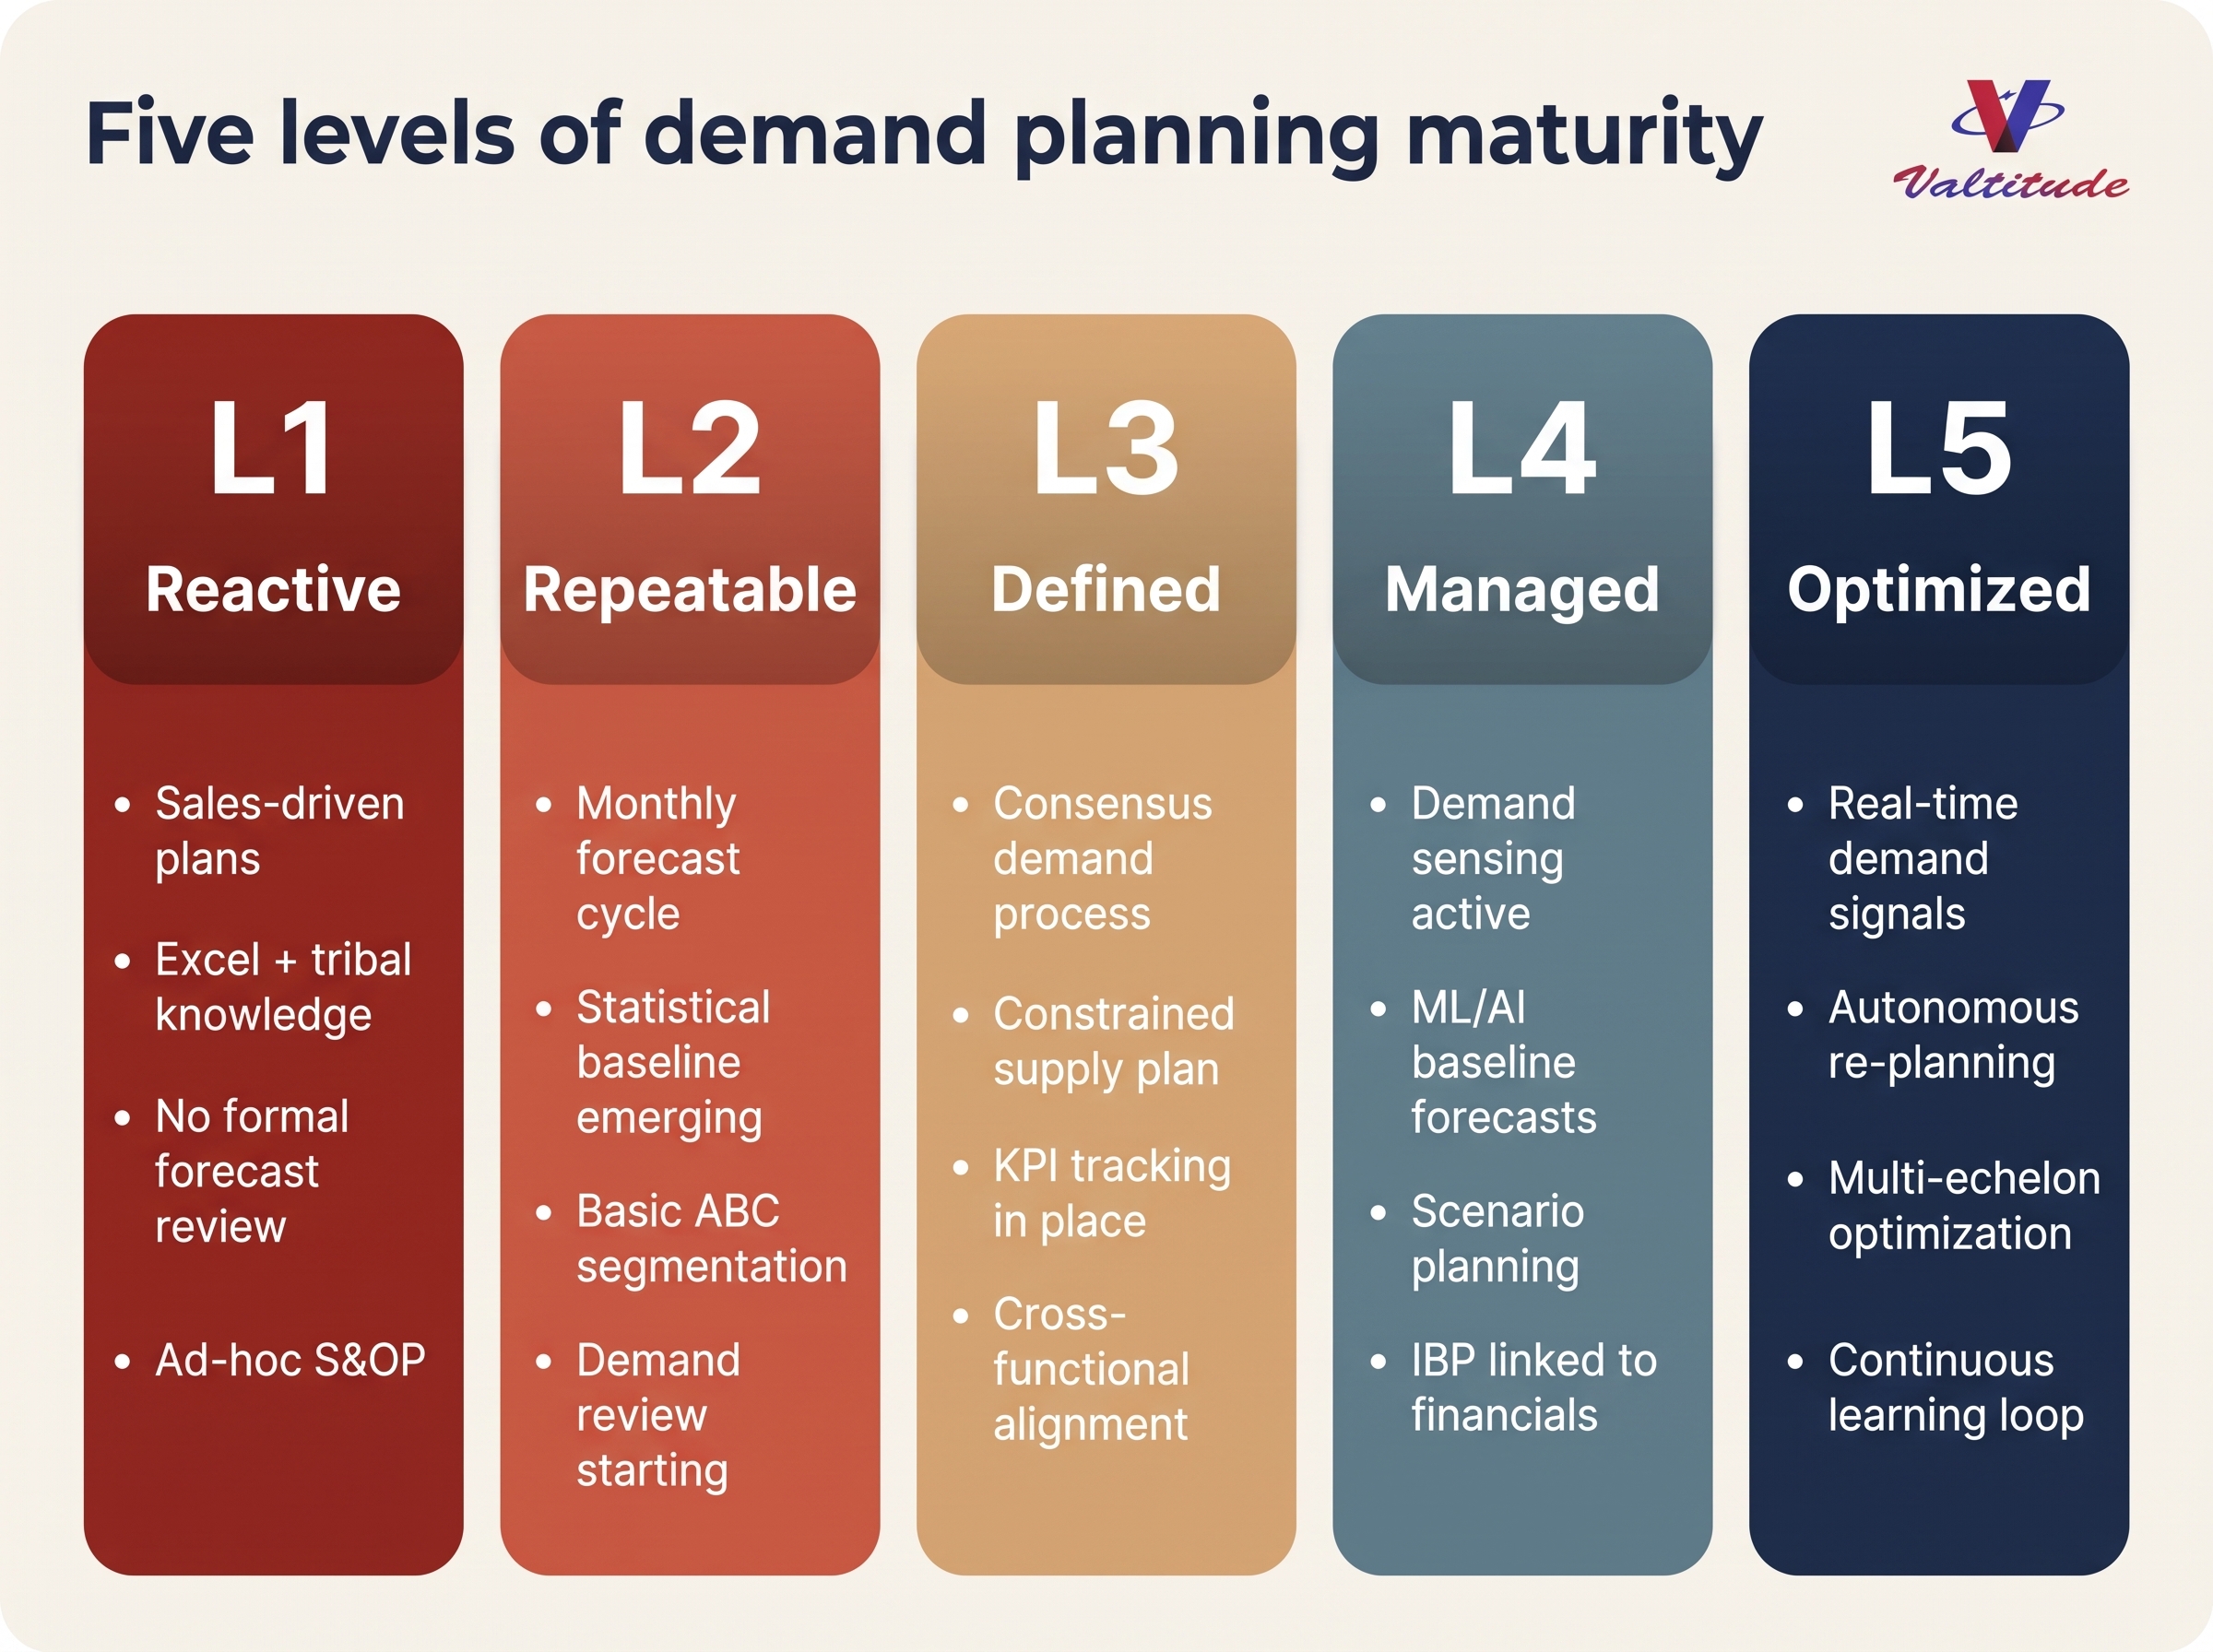
Demand Planning Maturity RoadMap
They buy the tools. Hire the talent. And run the transformation programs.
And yet, the monthly cycle still runs on tribal knowledge, ABC segmentation, and a statistical baseline that is not fully tuned????
The uncomfortable truth? Moving from Repeatable → Defined → Managed → Optimized isn't a technology issue.
It is one of process intelligence and discipline created by reinforced learning through a Center of Excellence or Peer support.
- L1 → L2 is easy. Buy a good Stat tool that runs ETS, Holt Winters.
- L2 → L3 requires process rigor and cross-functional trust.
- L3 → L4 requires analytics muscle, advanced tooling and sponsorship.
- L4 → L5 requires a learning culture and expert guided COE.
Each jump breaks something comfortable????
Curious where your organization sits on the demand planning maturity curve and what the L4-L5 roadmap looks like? Read more at https://valuechainplanning.com/domain/Demand-Planning-
Read more on this at
A Practitioner's Guide to Integrated Demand Planning
Leave a Reply